The periodogram is the simplest and most common spectral estimator and, in R is implemented as
findPer <- function(x){(1/length(x))*abs(fft(x))^2},
but there are may othere spectral estimators*.
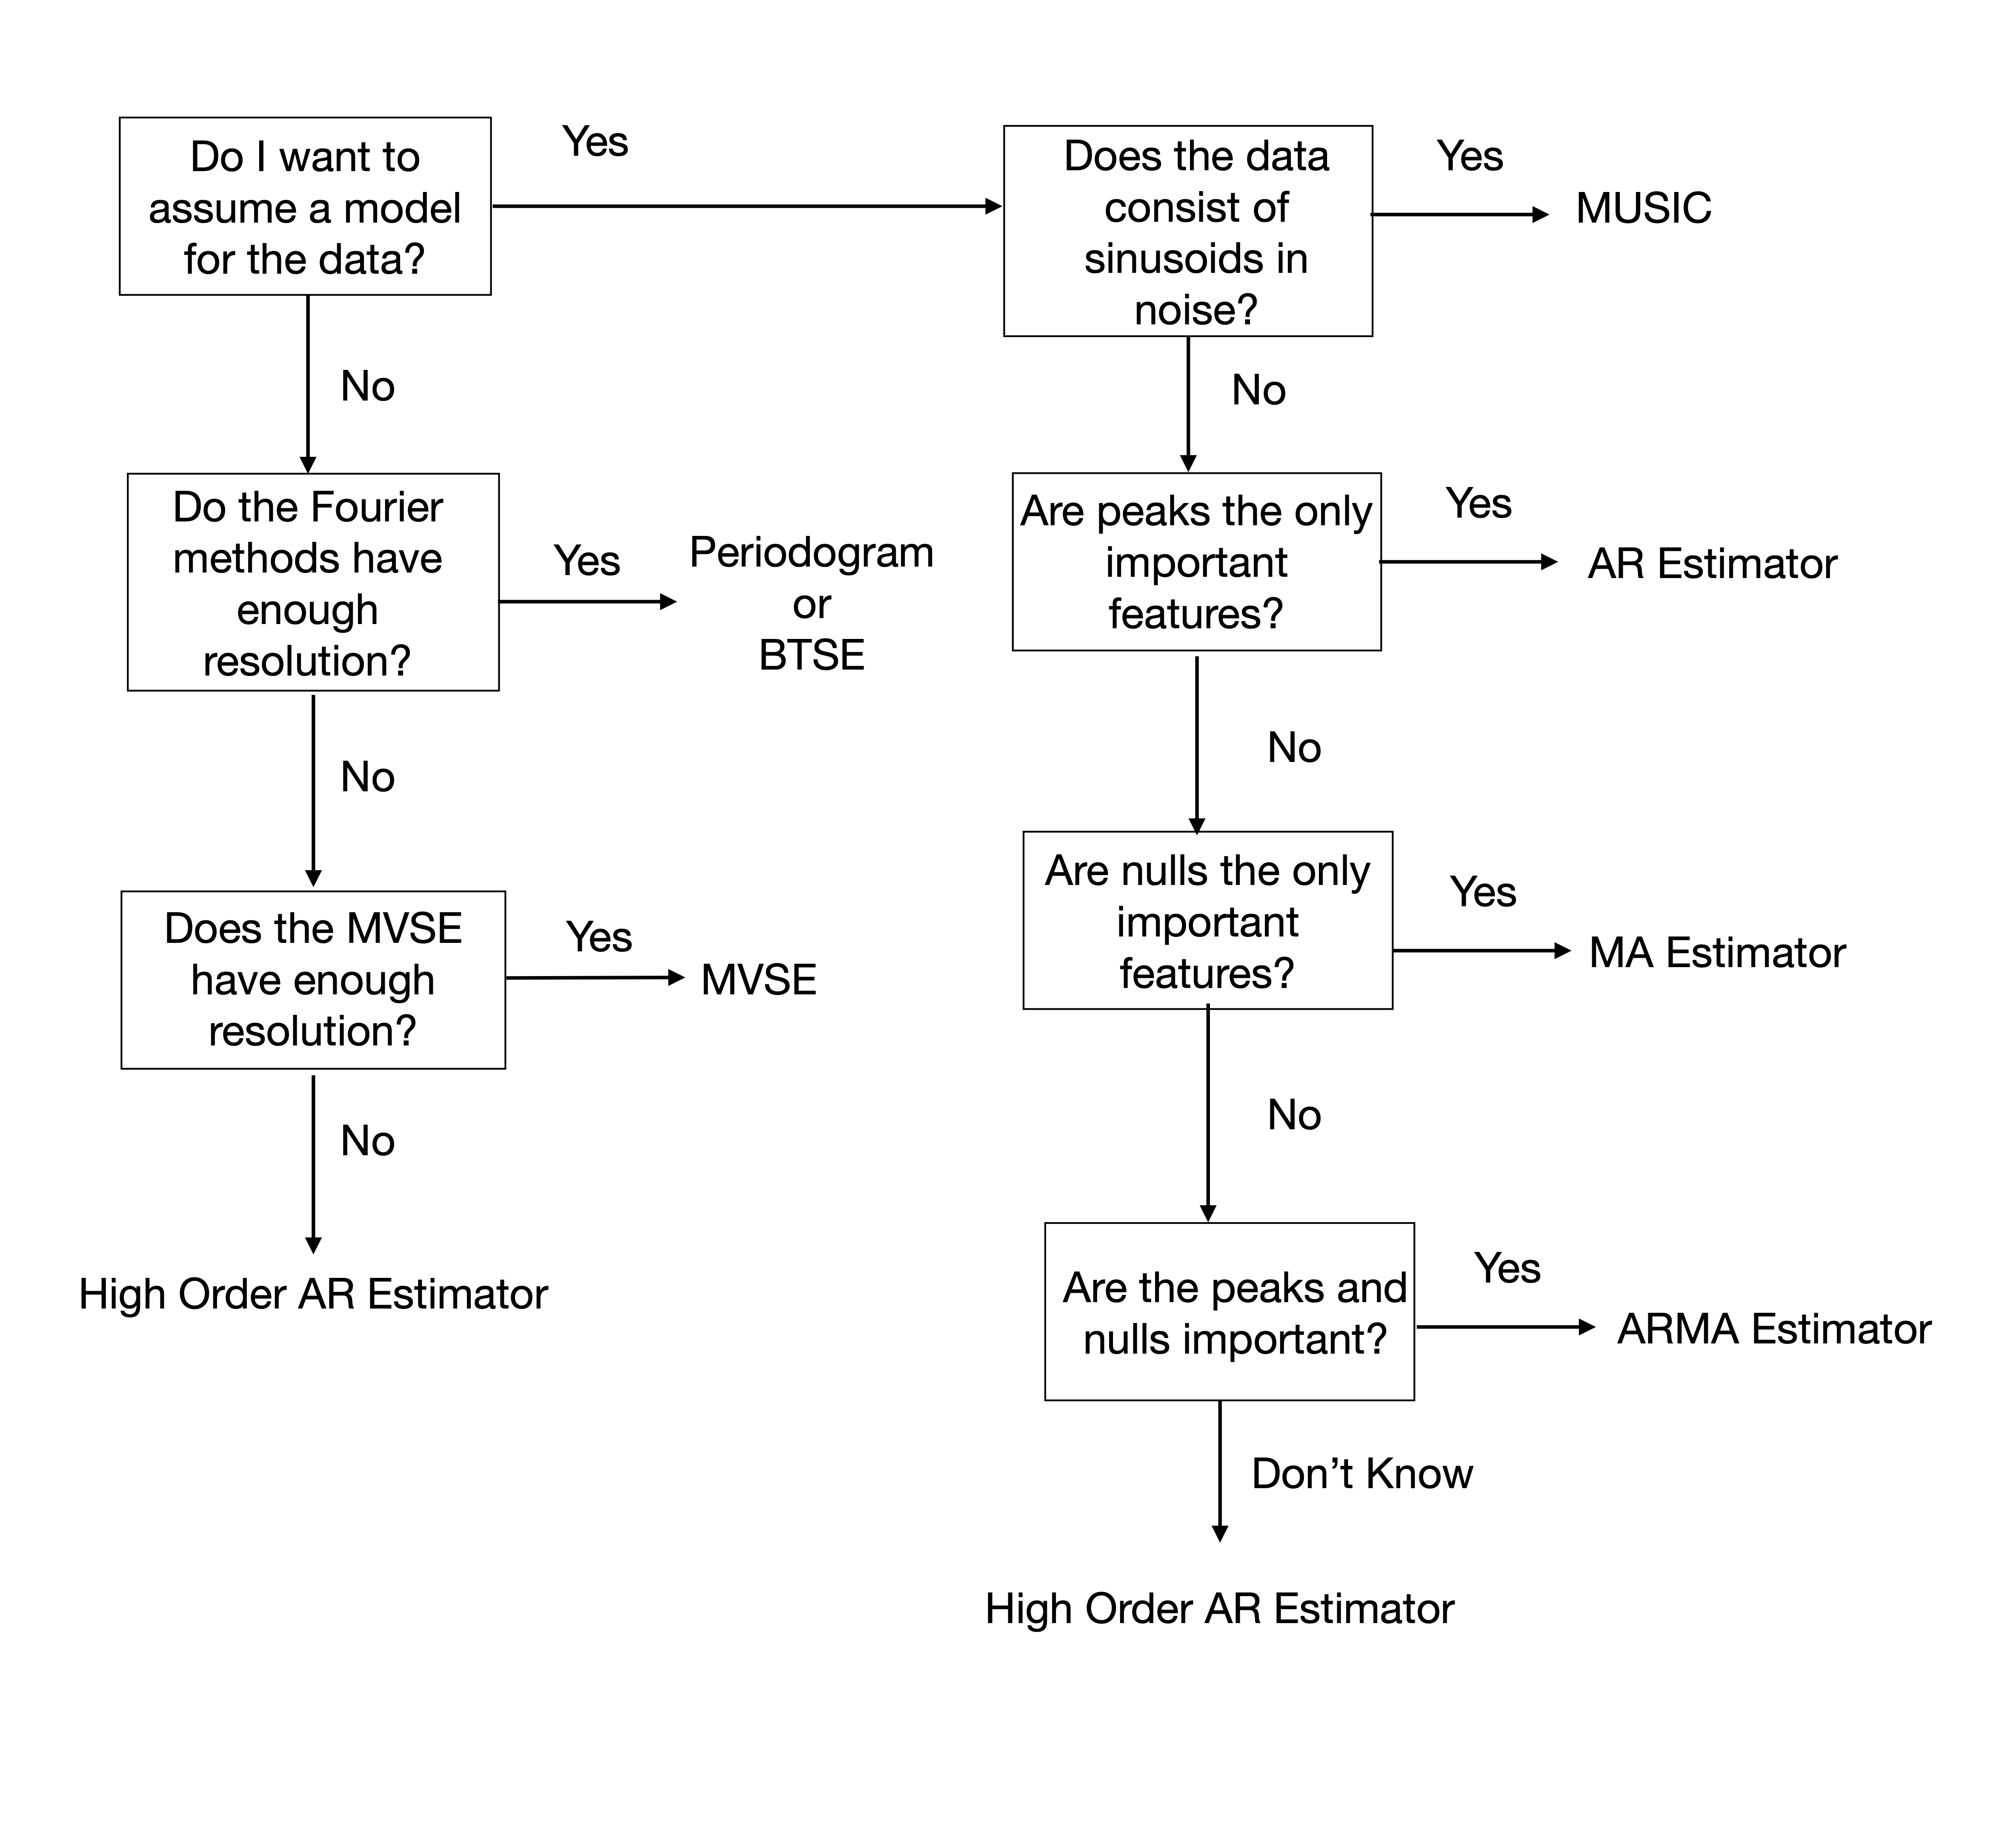
So, which spectral estimator should you pick? The flow chart below presents a reasonable way to pick between spectral estimators. The first question you should ask is, do you want to assume a model for the data? If you don’t know anything about the data or don’t trust what you know, then move to the left side of the flow chart. If the Fourier methods have enough resolution, use the periodogram or the Blackman-Tukey spectral estimator (BTSE). If they don’t, you could try the minimum variance spectral estimator (MVSE). If the MVSE does not have enough resolution, try a high order autoregressive (AR) estimate. The AR method does assume a model for the data, but a high enough AR model can estimate any PSD.
If you want to assume a model, we move to the right side of the flow chart. If we know the data consists of sinusoids in noise, then the multiple signal clarifier (MUSIC) estimator is a good choice. If the important features are peaks, but the data is not made up of sinusoids in noise, the AR estimator is a good choice. If nulls are the important features, then use a moving average (MA) estimator. If the important features are nulls and peaks, use the autoregressive moving average (ARMA) estimator. Finally, if you have no idea about the PSD shape and want to use a model, you could try a high order AR.
* For more info on spectral estimation, see my new book! -> Power Spectral Density Estimation by Example


No comments:
Post a Comment